Summer 2021 Northeastern US/Canada Lymantria Moth Defoliation
Episodic eruptions of the Lymantria dispar moth are among the easiest forest disturbances to map with existing remote sensing technologies. Canopy defoliation occurs during the peak early summer growing season (Coleman and others 2020) and mapping is only limited by cloud cover. High frequency imagery readily shows week-to-week progress of defoliation as caterpillars outpace late spring and early summer phenological green-up, and this is best revealed by twice-daily MODIS which most reliably can capture this dynamic unimpeded by clouds.
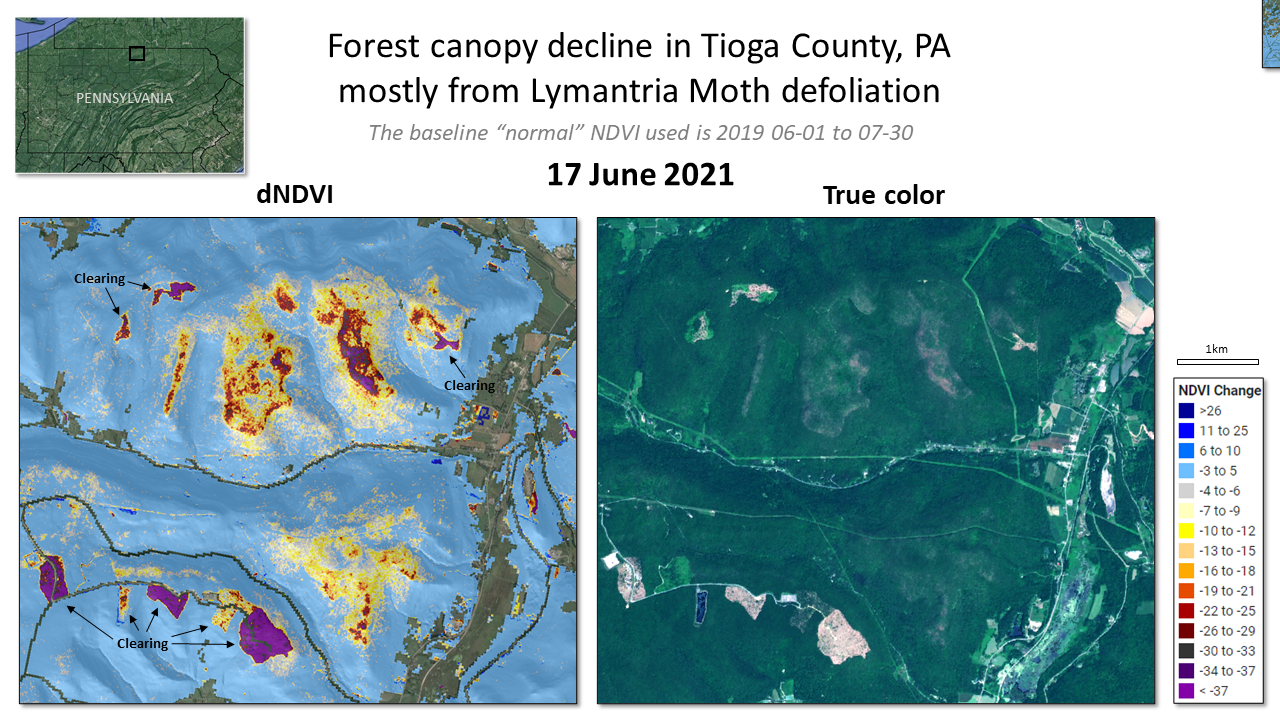
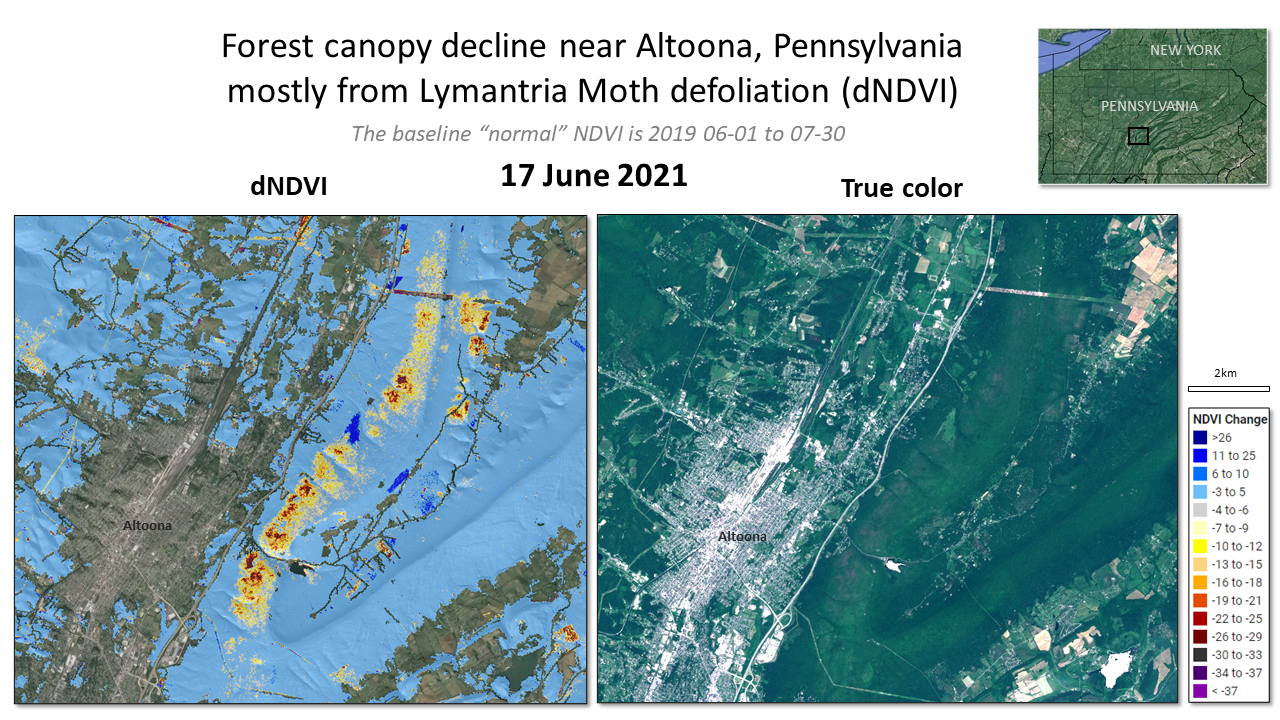
Like other insect defoliations, those caused by this non-native moth exhibit remarkable gradients of severity as the season progresses and for the growing season overall. Textural patterns of canopy loss can be suggested by 240m MODIS imagery, but patterns are remarkable when departures from expected greenness is mapped at 10 or 30m resolution. These patterns result from a complex combination of land cover type, caterpillar density, host tree susceptibility and natural or management control efforts.

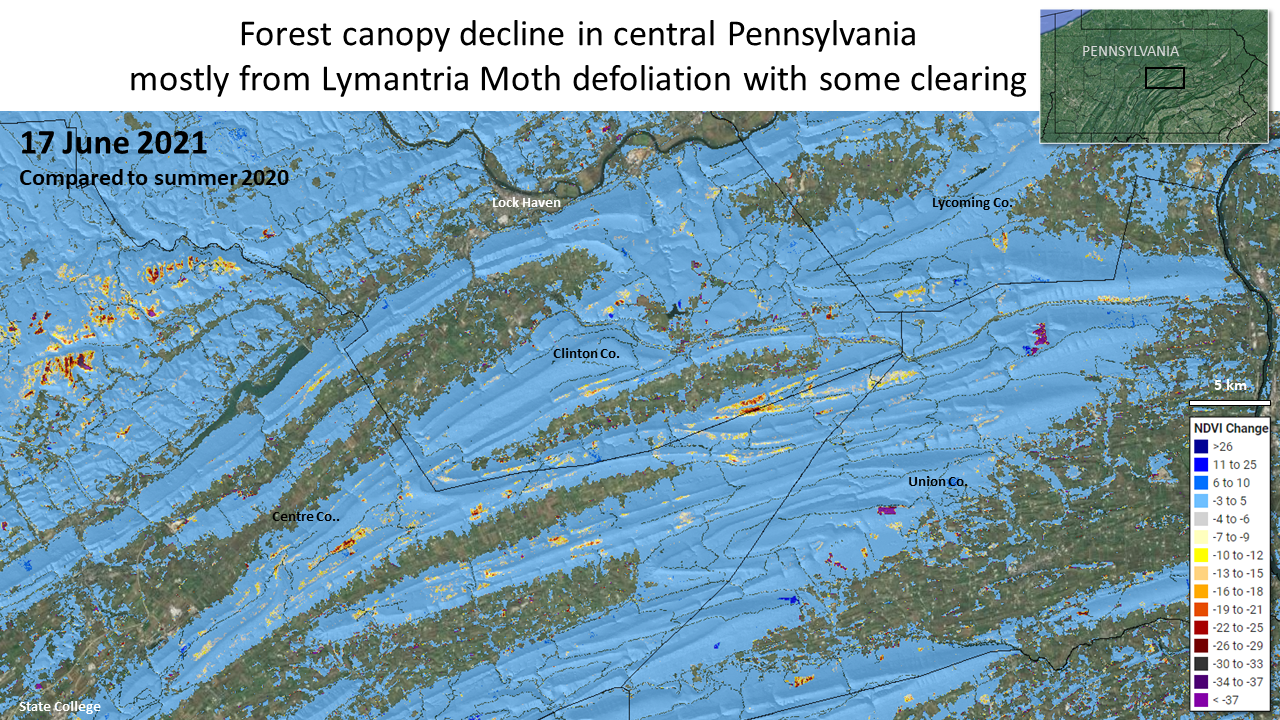
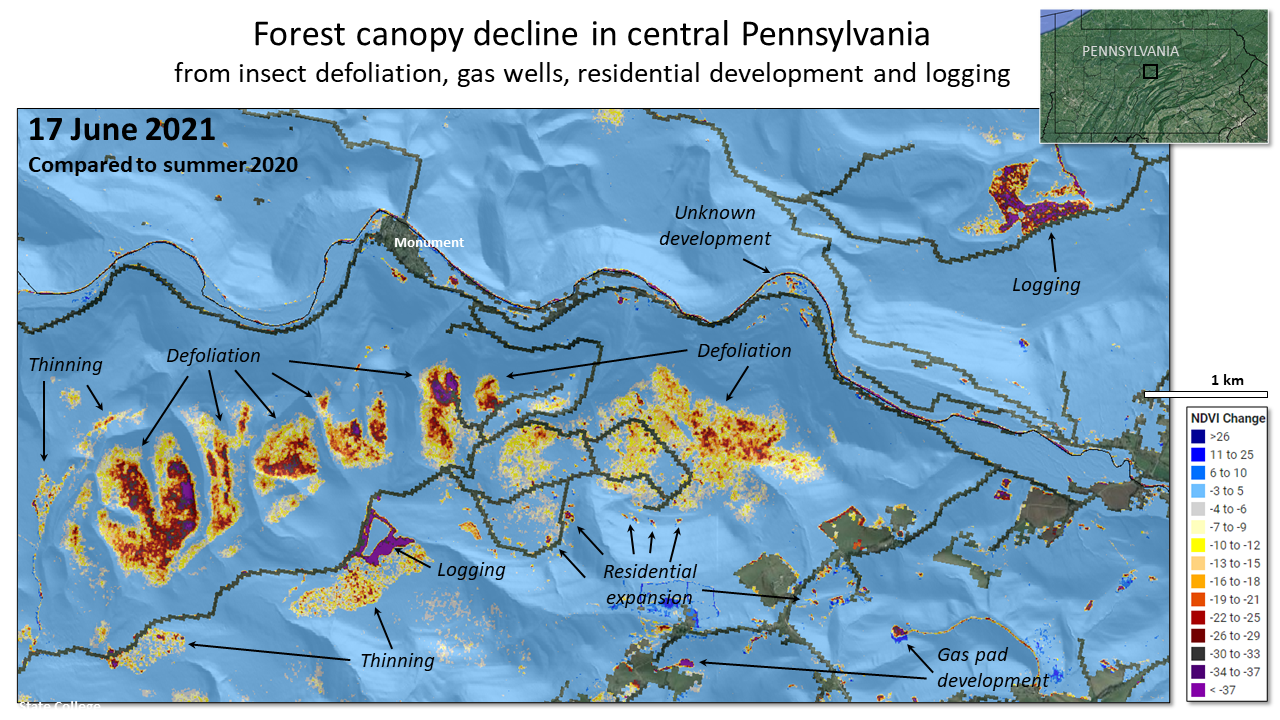
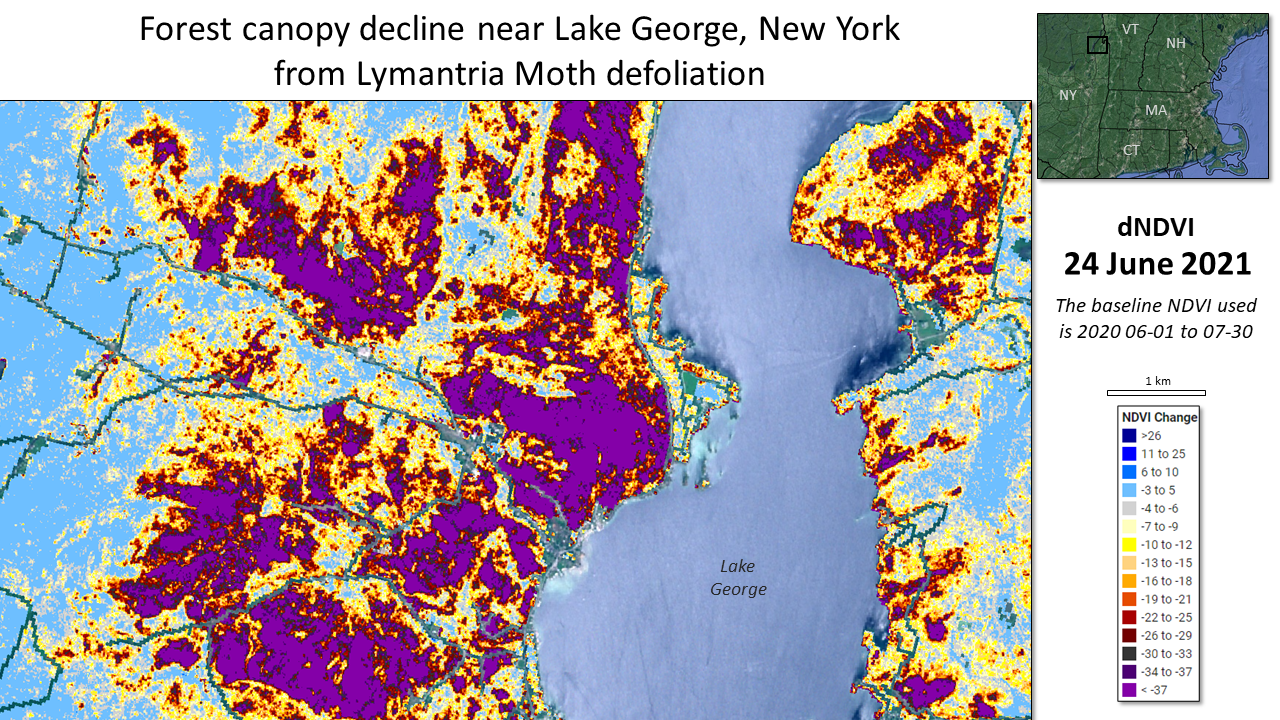
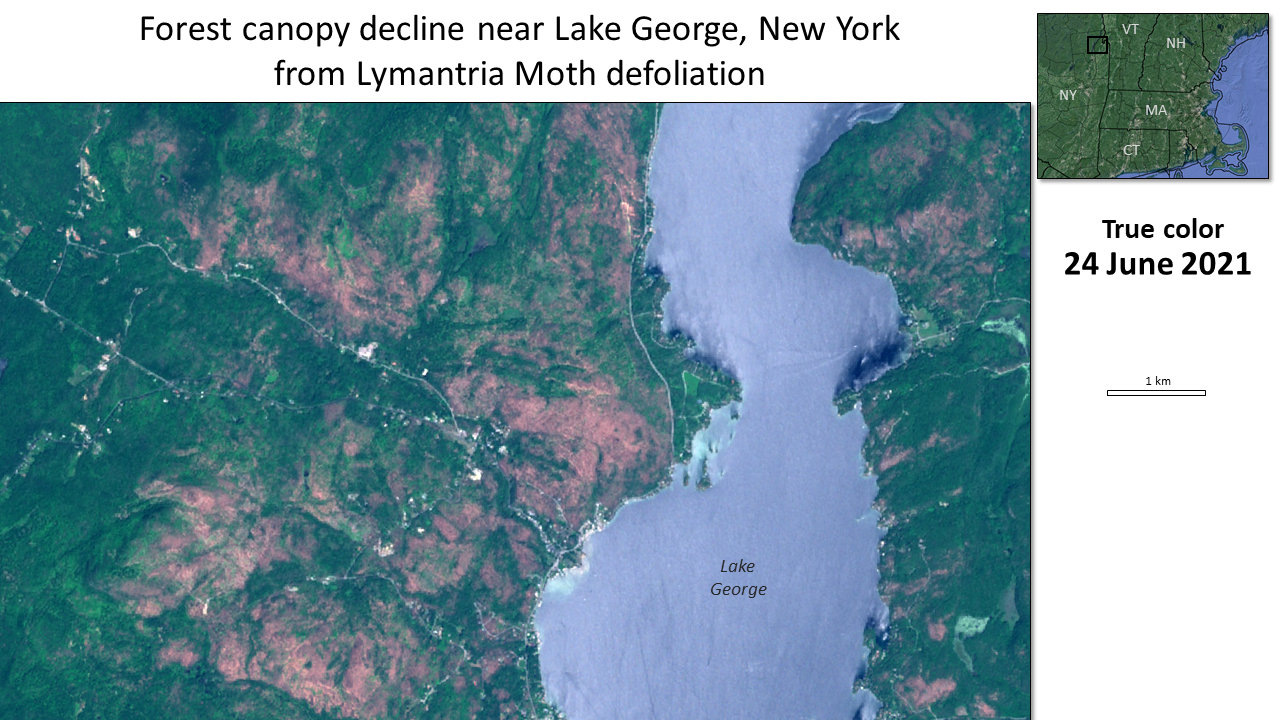

From a landscape perspective, defoliations show a severe, rash-like core area, with mild impacts in surrounding areas that sometimes extend over miles. When multi-year defoliations occur, these low impact areas can be severe in the second year, but severe declines are uncommon over two sequential years unless there has been mortality. This may reflect natural controls that limit the population. In montane mixed conifer-hardwood forests we see textural variation that is suggestively caused by host tree patterns--xeric oak dominated forest types can be more severely and rapidly defoliated than are mesic valley sites. While we lack species resolution maps for any extensive area, the patterns we see often correspond to coarsely mapped vegetation types, topography and conifer crown density.
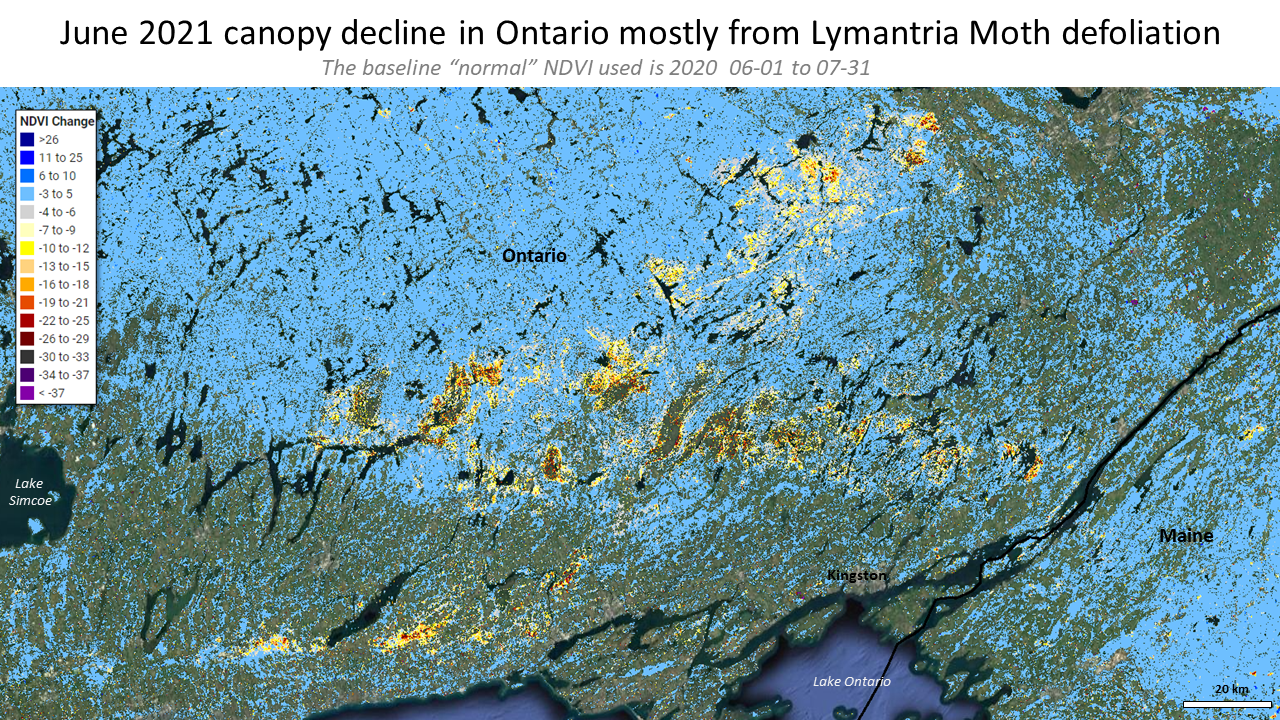
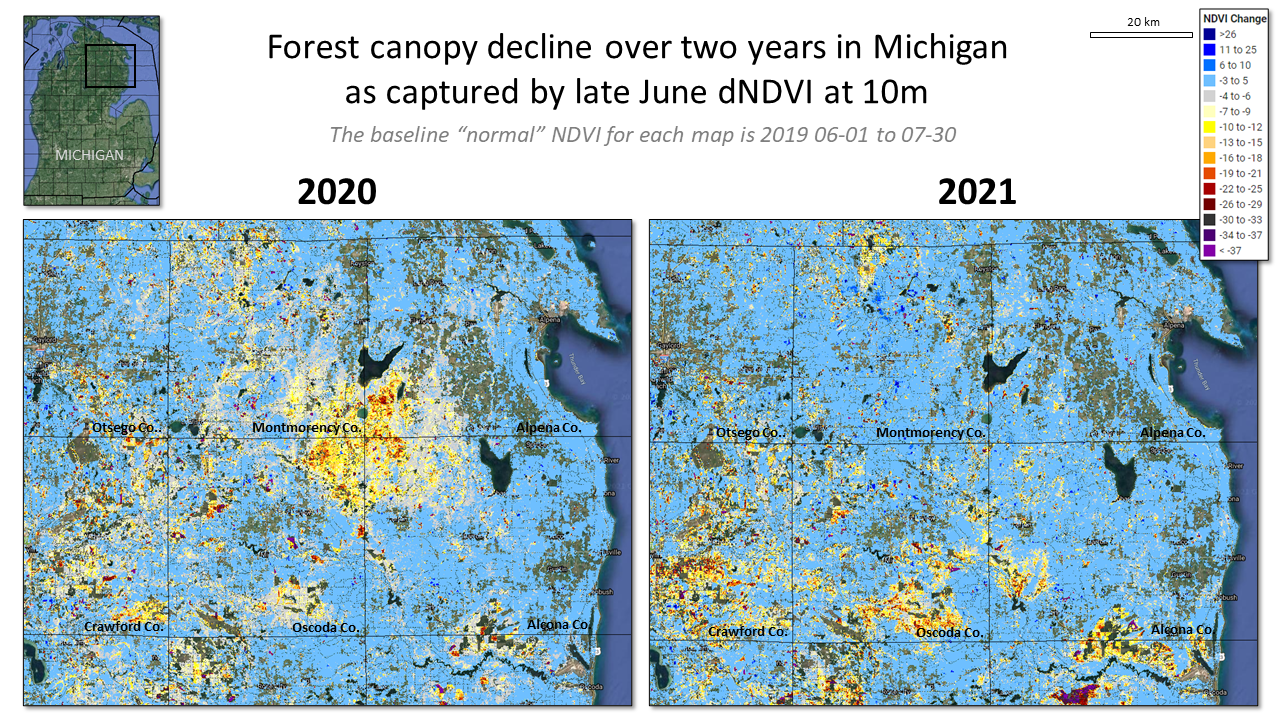
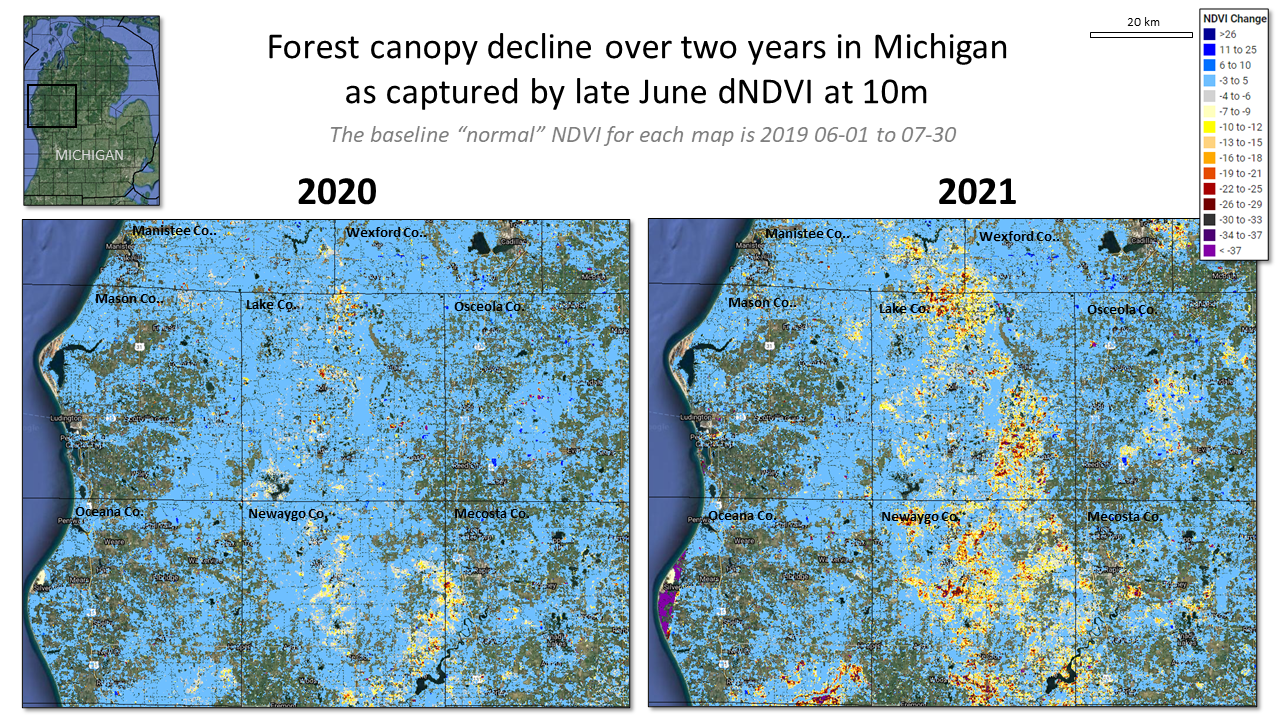
2021's outbreak is remarkable because it has been detected in least nine states and a Canadian province and because of its extent across Michigan and Ontario in particular. Michigan's lower peninsula was hard hit in 2020, and 2021's defoliation is also severe, but the areas of greatest impact have usually shifted. These maps use a 2019 baseline to better show those areas that were impacted during both years.
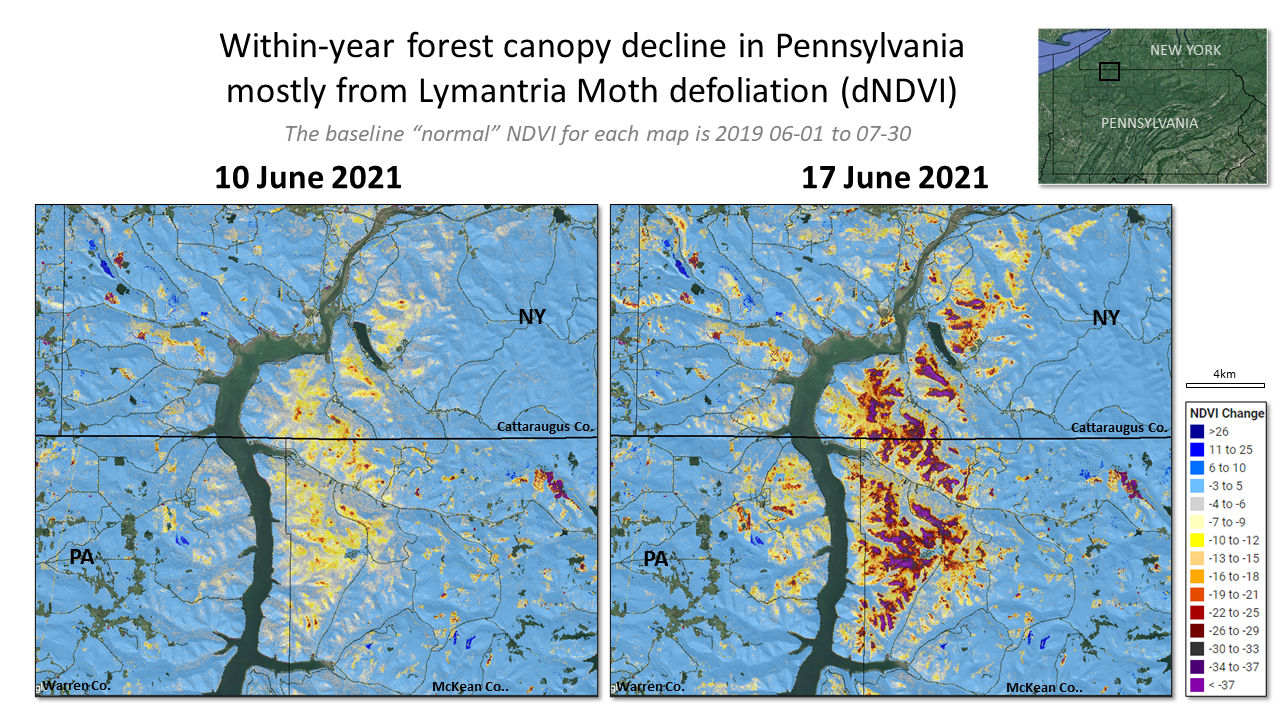
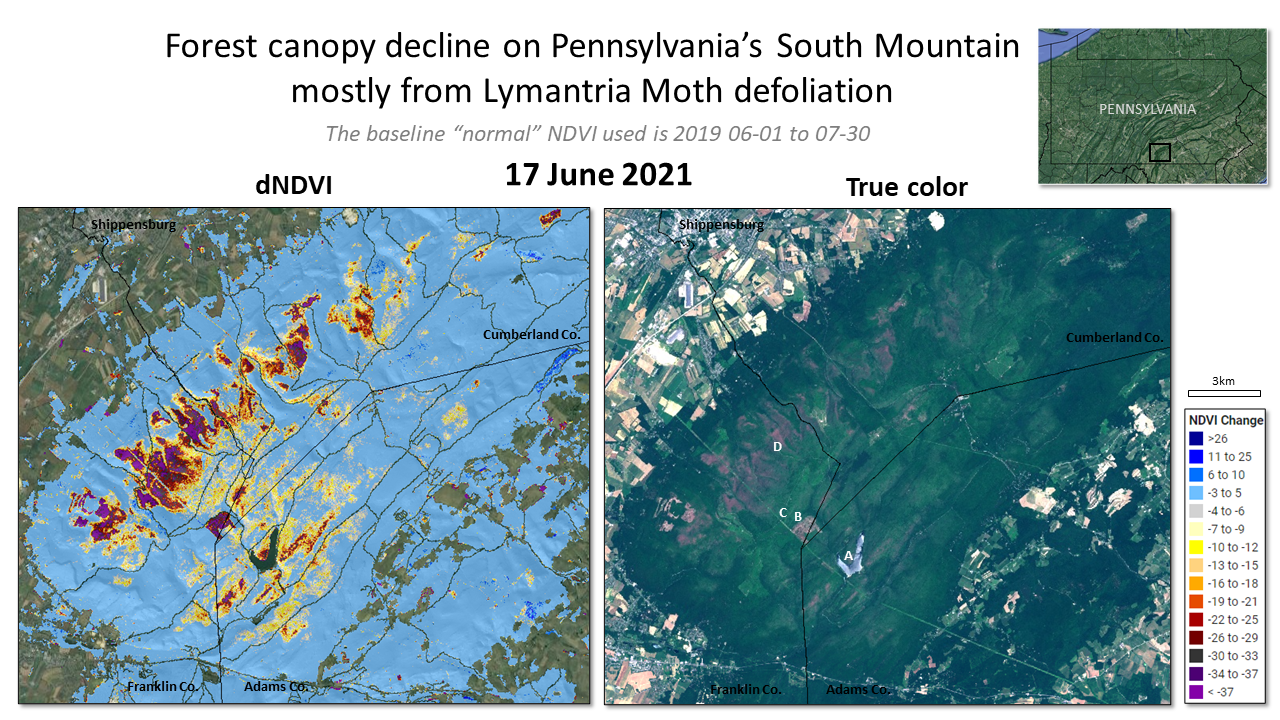
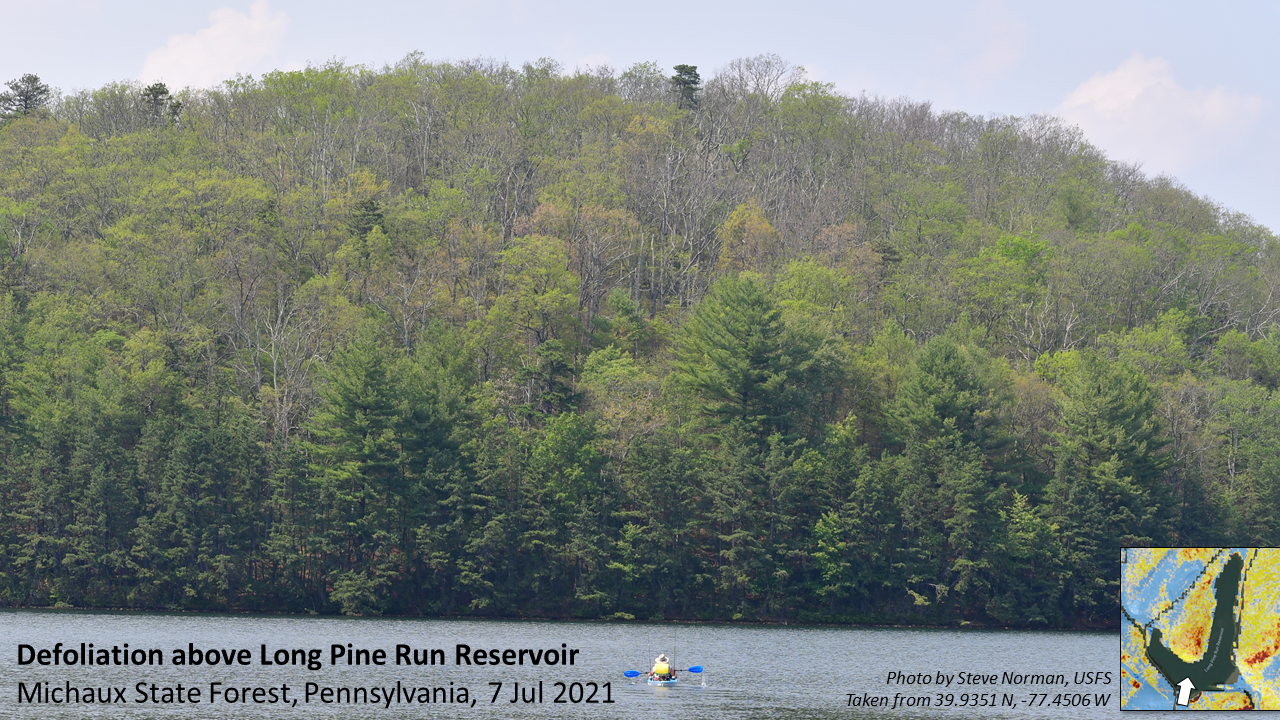
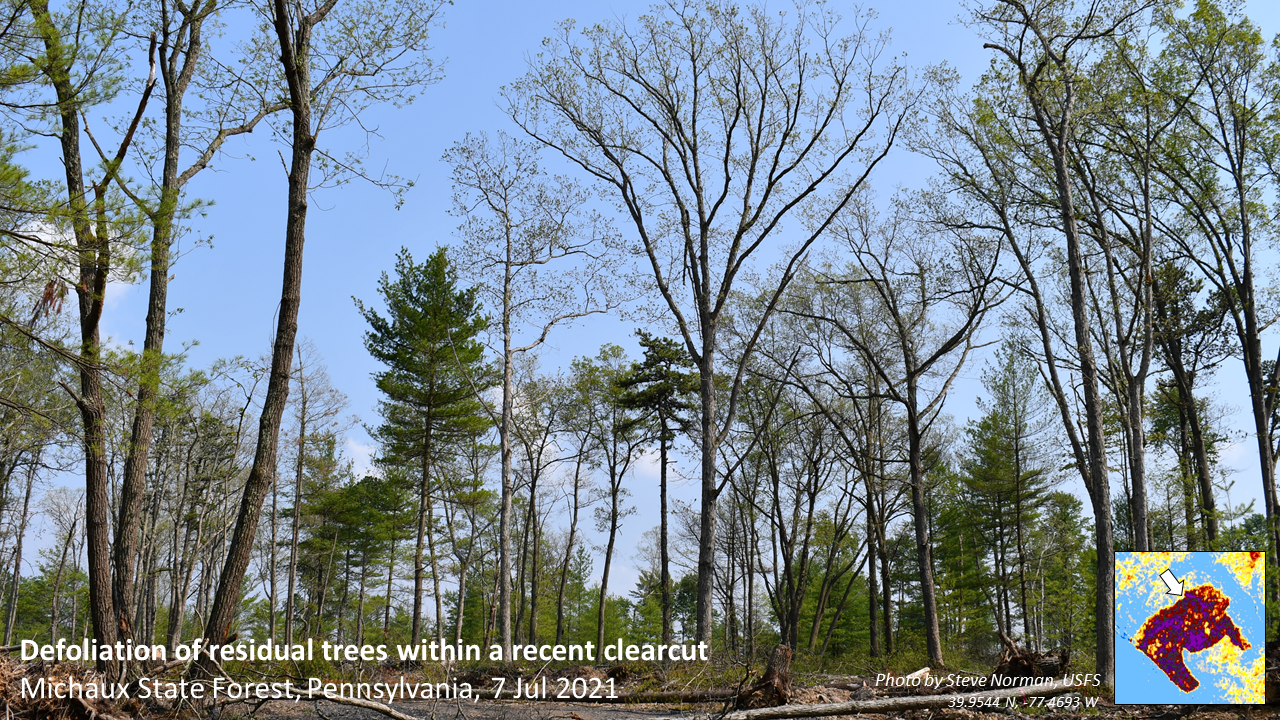
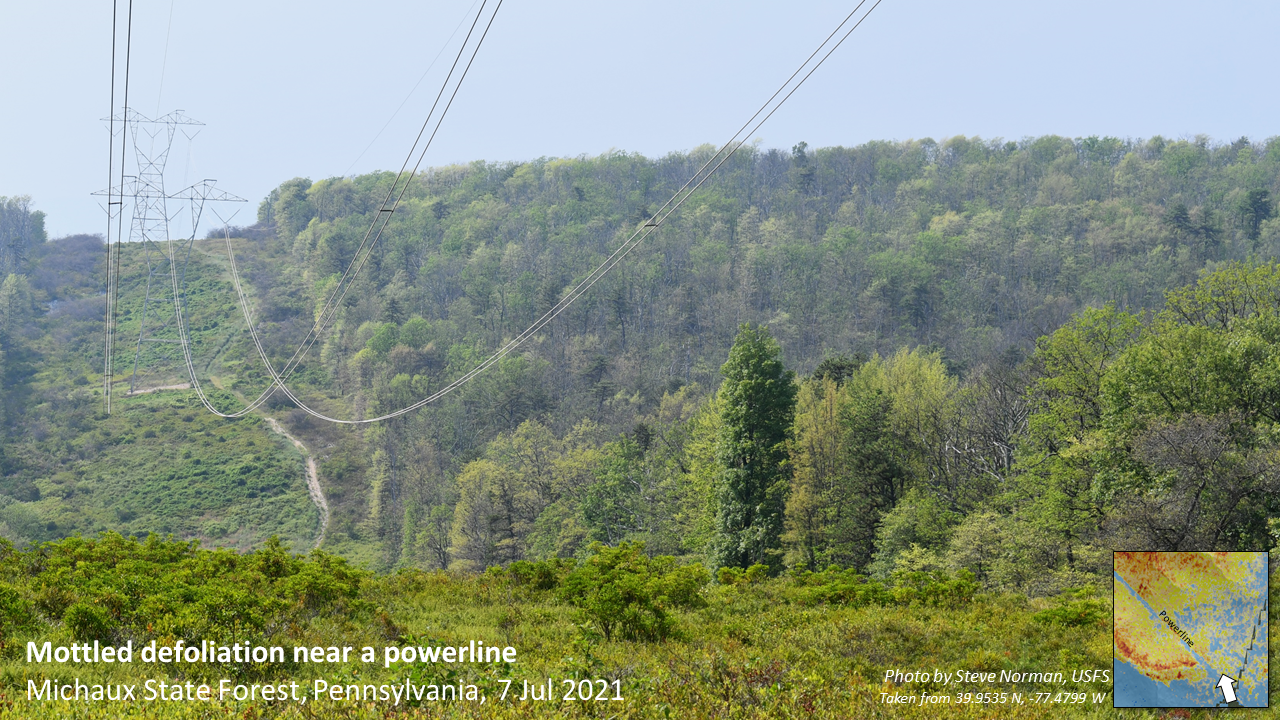
In Pennsylvania, several severe outbreaks occurred across the state including McKean and Warren Counties in the northwest, Tioga County in the north, Centre, Clinton, Lycoming, Union and Blair Counties in the northcentral part, and Franklin, Adams and Cumberland Counties on South Mountain. Impacts are focused on drier upper slopes where the moth's host trees are more concentrated, but at 10m, lesser impacts can sometimes be seen extending downslope toward mid-slopes and drainages. As 10m is the approximate size of a large canopy tree, this textural pattern may show individual isolated host trees in mixed forests where local defoliation pressure is low.
Over many decades, targeted efforts have been made to map defoliation across the northeast. Integrated use of aerial flights, field surveys, and near-real-time high resolution maps of change as shown here, can make that monitoring more consistent, efficient and effective.