Spring 2024 Spongy Moth defoliation for WV
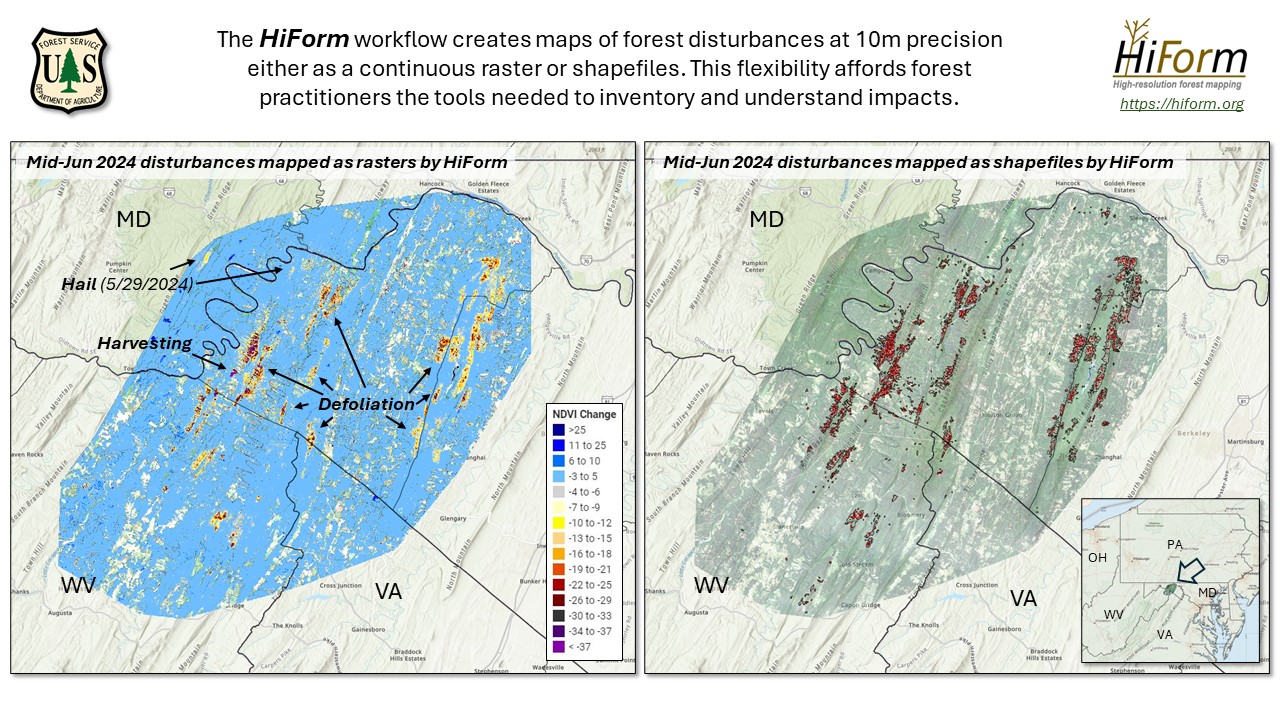
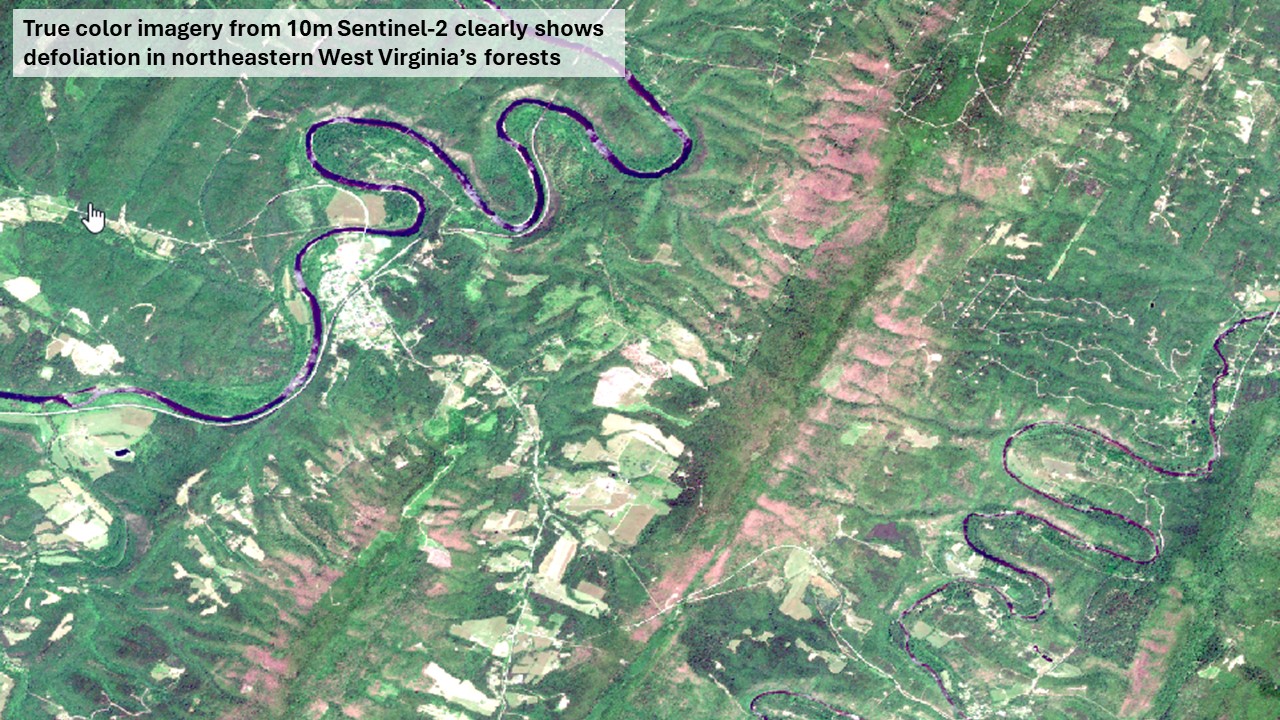
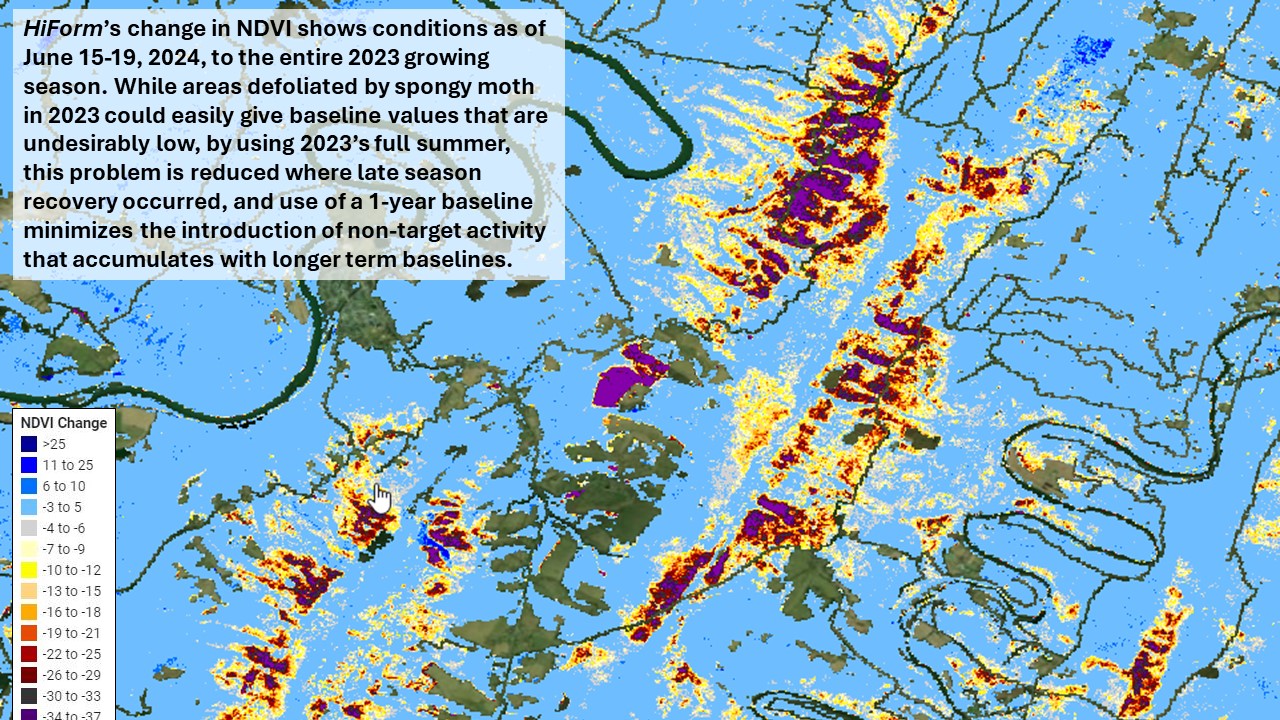
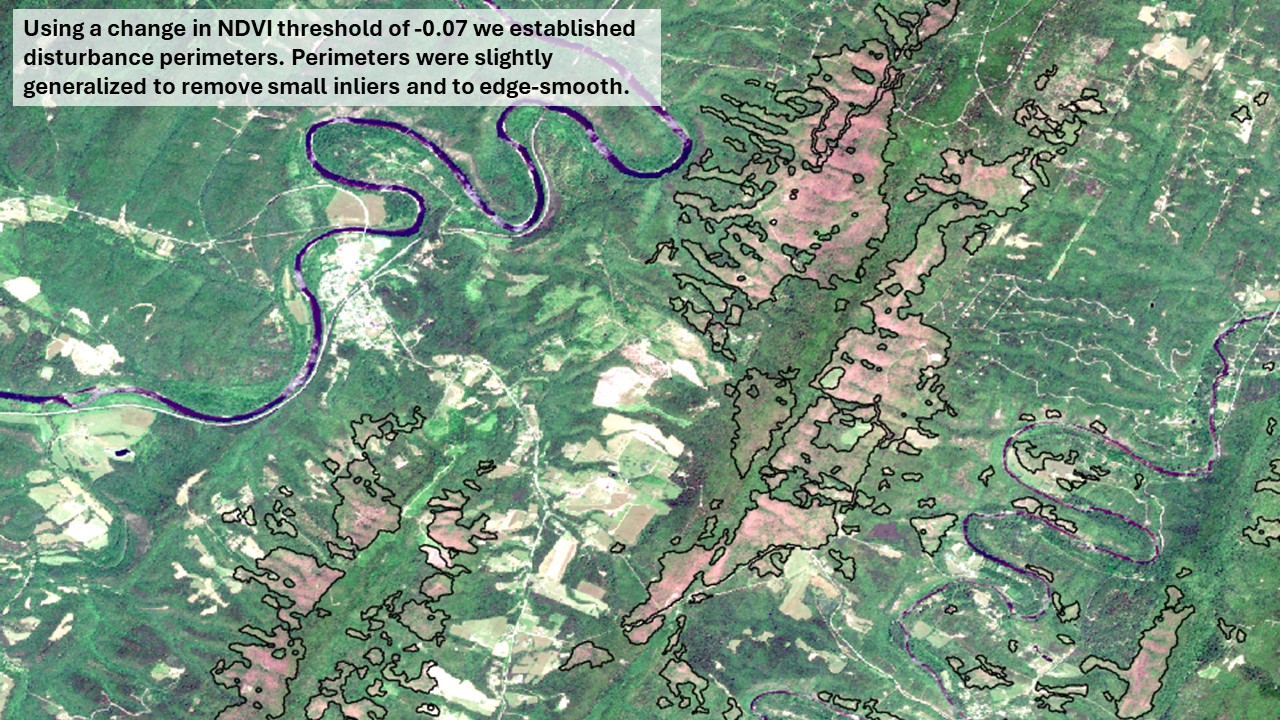
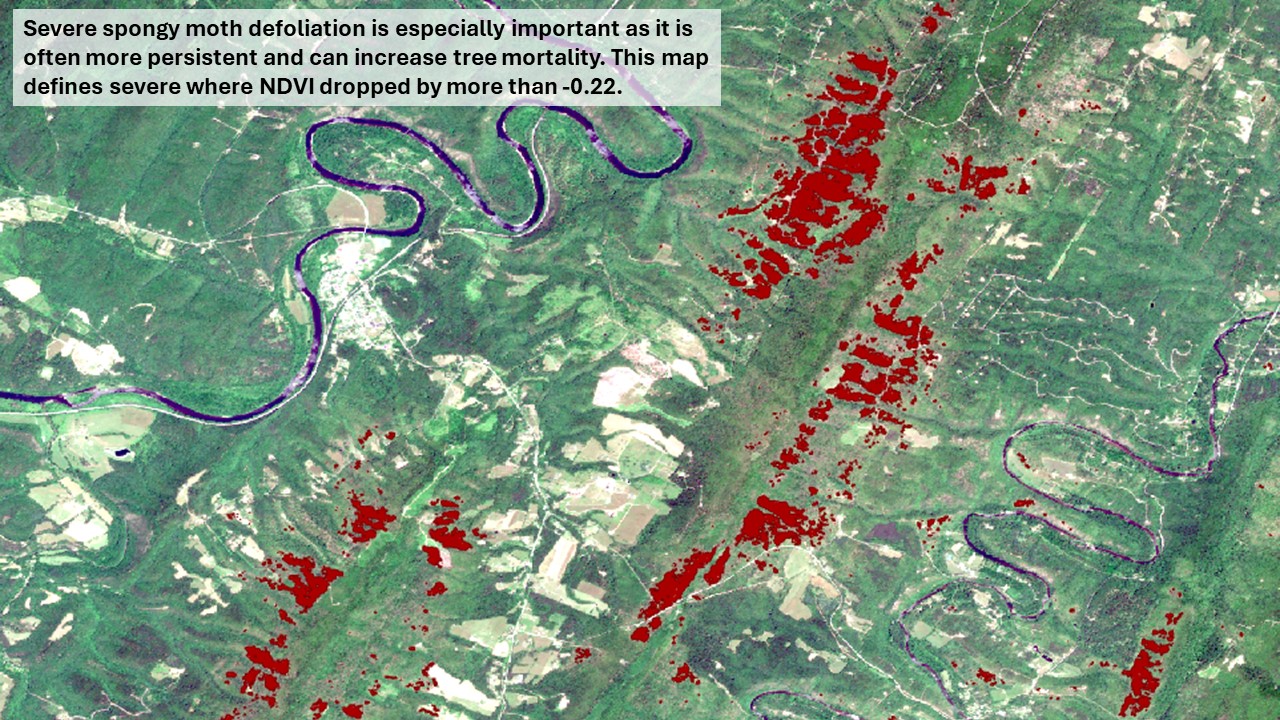
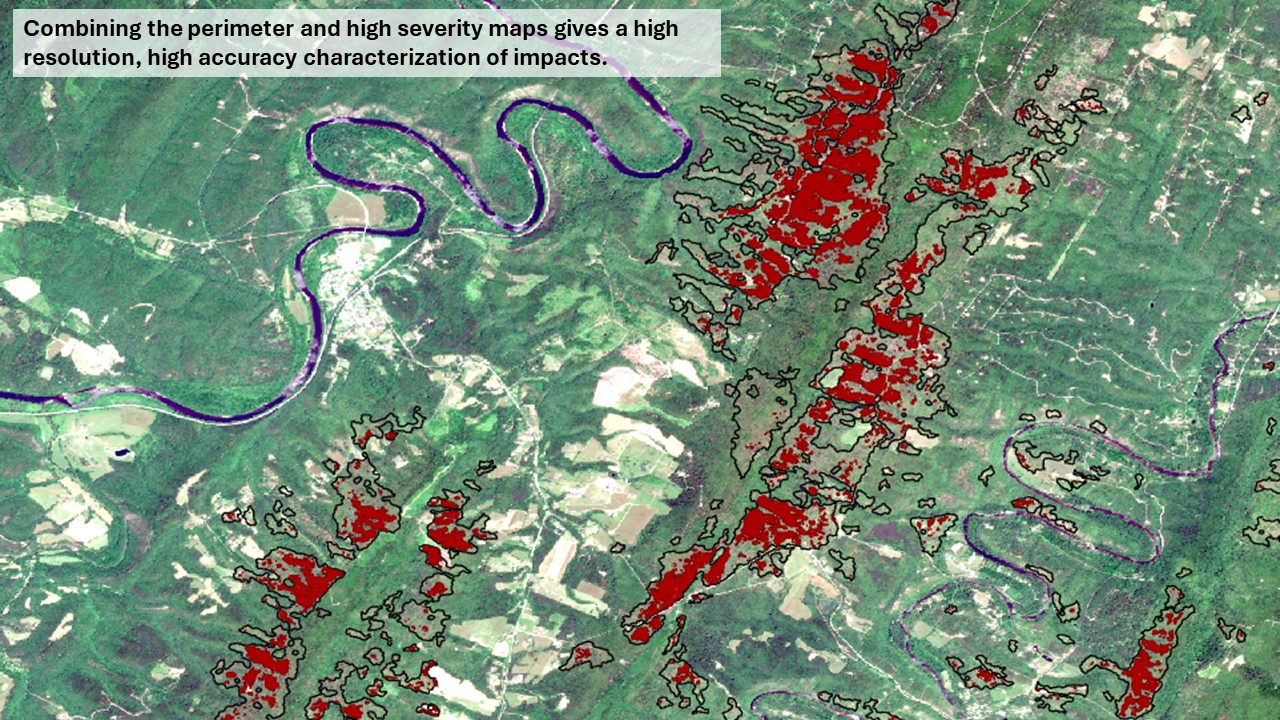
Each year, the non-native invasive Spongy Moth defoliates forests in the eastern US. Ecologically, recurrent severe defoliations can lead to tree mortality and in any given year, defoliation can disrupt recreational activities of forest visitors. Having accurate maps of impacts is important for planning purposes, such as prioritizing egg mass monitoring and aerial treatments the next spring. For decades, state and federal agencies mapped these early-season defoliations by aircraft, but the role of remote sensing is of growing importance for its cost-efficiency, accuracy and coverage. When repeated cloud-free imagery is available during May and June, the progression of defoliation can be easily tracked, as can its year-to-year severity. The example below from West Virginia highlights an effective workflow for mapping spongy moth defoliation from 10m Sentinel-2 imagery in Google Earth Engine by compared to conditions during the 2023 growing season to June 15-19, 2023 using change in the Normalized Difference Vegetation Index (NDVI). We defined the "defoliation perimeter" by thresholding change to a reasonable degree of change (-0.07 NDVI and below), then isolated the extreme canopy defoliation with a lower threshold of -0.22. This approach parallels the standard workflow used by to map wildfire polygon perimeters separately from the severity of effects within (as a classed raster). In these maps, the polygon was generalized to remove small inliers to more faithfully emulate the more generalized polygons typically used by forest health monitoring efforts. The specific causal attribution of each perimeter is a critical step that involves a combination of field observations and imagery interpretation. In this example several polygons of silviculture and a May 29, 2024 hailstorm were removed based on imagery interpretation and ancillary information from NOAA.
These are demonstration research maps. They are not official forest health maps of this disturbance.